


Post-election Roundup
Thoughts on the result and whether the polling was any good

It’s done. After a long night full of surprises and dramatic results the new government is in place, I have caught up on sleep, and I have now finally found the time to set down some thoughts. At length.
Here is your new parliament:1

It is rather different to the old one. In broad strokes what was predicted by many has come to pass: a massive Labour majority, the Conservatives reduced to a pale shadow of their former selves.
But to really understand what just happened it pays to be more self-critical. Having slept on it, here’s how I’m feeling about the set of predictions I made last week2.
The Good
The fundamental dynamics of this new parliament are as I expected them to be. There is a stonking Labour majority (they won 412 seats out of 650). The Conservatives had their worst result ever, but remain the official opposition. The Liberal Democrats experienced a resurgence and the Scottish National Party were knocked back.
I’m happy I picked up the late swing to the Conservatives visible in the final polls. If I’d just gone with the consensus figure from the ‘Megapolls’ I’d have predicted 100 seats. I said 110—and noted that if the swing continued growing through to polling day (which seems to have happened: the final Conservative vote share was 23.7%) they could go to, say, 117 seats. They got 121.
I felt that the late swing would prevent Reform breaking through in many of their best prospects. I predicted low single digits for the number of seats they would win. Five seats is perhaps a little more than I suggested but doesn’t feel surprising; some of those wins were really tight.

The Bad
I thought the Scottish National Party would be rolled back, but the surprise for me was the scale of their defeat: reduced to single digits.
For now the spectre of Scottish separatism has been banished—just under a decade after that surprisingly close-fought referendum triggered a political earthquake—and we can likely point the finger at the scandals that have plagued the nationalist party, as well as the woes of a government that has been in power for many years now. The Labour party is the primary beneficiary.

I'd read about Blue/Green battleground seats, but wrote off the idea that the Greens would win these. I expected them to win at most two seats (in Brighton and Bristol). They did twice as well as I expected, winning four.

I missed their two rural gains, North Herefordshire and Waveney Valley—the latter a victory where the redrawing of constituency boundaries perhaps allowed them to campaign without the burden of a pre-existing result. Certainly boundary changes made constituency predictions more challenging for pollsters.
The Ugly
I flagged the late swing—and more Conservative seats would imply a lower number of Labour/Liberal Democrat seats. So were my predictions of 450 for Labour and 60 for the Lib Dems good? I'm not entirely happy. The Lib Dems did better than I expected (72 seats—their highest total in a hundred years), and Labour did worse (412 seats) despite doing better than I'd expected in Scotland.


What happened there? Some strong independent challenges to Labour were a factor, but the truth is that there was a polling miss!
There's no way to sugar-coat it: all pollsters had Labour between 36-41% of the vote in polls taken on Tuesday/Wednesday, and they got 34.7%3 on the day. While their share was falling in the final week, it wasn't falling that fast!
Most pollsters overestimated the Labour vote share by four percentage points. If it had been a close thing we'd be very critical of this4.
Here’s what that looks like:
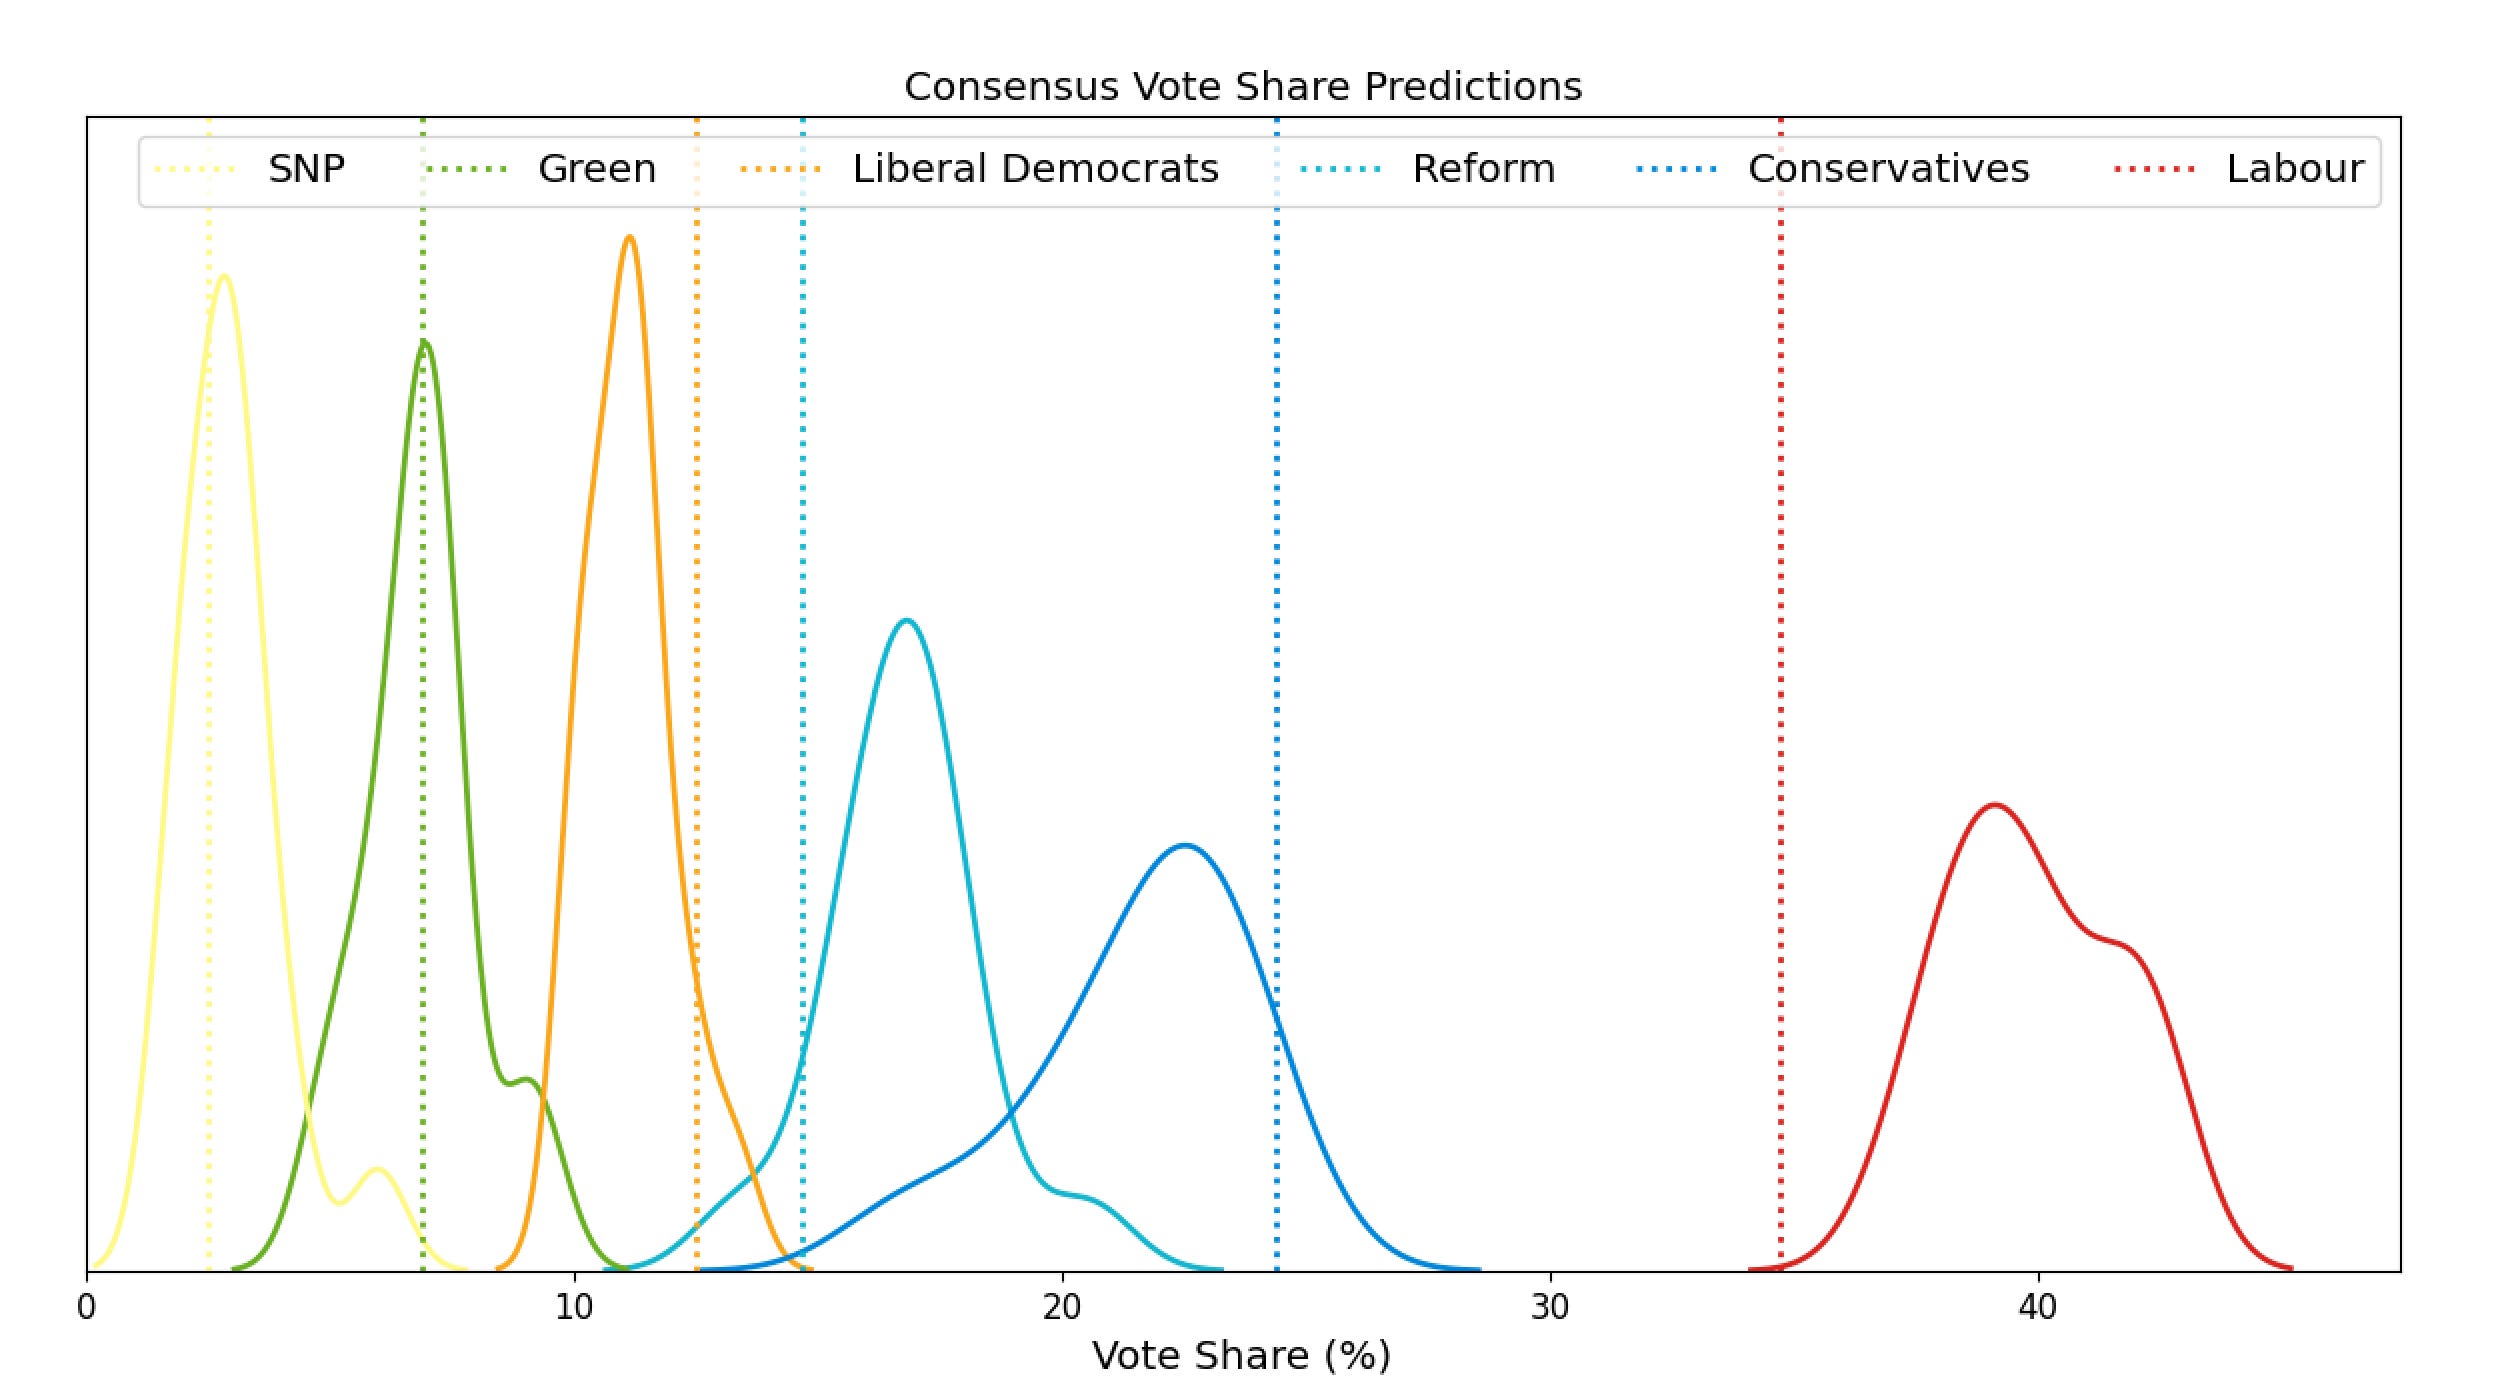
You can read this chart as follows:
dotted lines show the vote share in Great Britain for most of the major parties
solid lines show the distribution of predicted vote shares based on polls taken in the final week5
the peaks in these distributions tell you what percentage the largest number of pollsters were predicting for each party
What should we conclude?
Reform were slightly overrated and the Conservatives slightly underrated6. I put this down to the late swing we saw was underway in the final few days. I tried to account for this.
The Liberal Democrats were slightly underrated. I have a hunch that the ‘tactical voting’ effect may have become even stronger during the final push before polling day.
Labour really got a lot fewer votes than expected—their share of the vote was less than two percentage points higher than it was in 2019 (their previous, disastrous result).
What does this tell us?
Under our system it matters just as much where you get your votes as how many you have.

A savvy strategy might indeed sacrifice some voters who are concentrated in a few seats, in exchange for other voters that are spread more evenly. But if so, it’s important to understand that this is what happened … rather than continuing with the narratives we had before the election (when it seemed like Labour would win an exceptional number of seats and votes).
In practice a few things negatively affected the Labour vote share:
The move to the centre ground of British politics naturally opens a vulnerability on Labour’s left flank. It was inevitable that some of the supporters of Jeremy Corbyn would abandon the Labour party, even as Labour won in some seats they have never previously held and took back a swathe of Scotland.
The Conservative strategy of warning about a ‘Labour Supermajority’ cuts twice: first, to squeeze Reform and get out the core Tory vote. Secondly, to encourage left-wingers to vote for their preferred alternative, such as the Greens (safe in the knowledge that the Conservatives would nevertheless be ejected) and to make some Labour supporters complacent, lowering turnout.
This was an exceptionally low turnout election—60% rather than a more normal 70%. It is also the first General Election at which Voter ID has been required.
The conflict in Gaza loomed large during this election. Labour (perhaps acutely aware that it might soon be responsible for the UK’s foreign policy) struggled as it tried to strike a nuanced tone about an incredibly emotive matter. A result of this was the election of an unusual number of independent candidates in England.


Summing up
All told, there’s something really unusual about the Labour result—their vote share went down in the majority of the seats they already held.
I’m going to show you a graph where each point represents a single constituency. On the horizontal axis is the share of the vote Labour achieved in 2019. On the vertical axis is the share from last week.
I’ll show you it twice—once with the points coloured by 2019 winner, once by 2024:
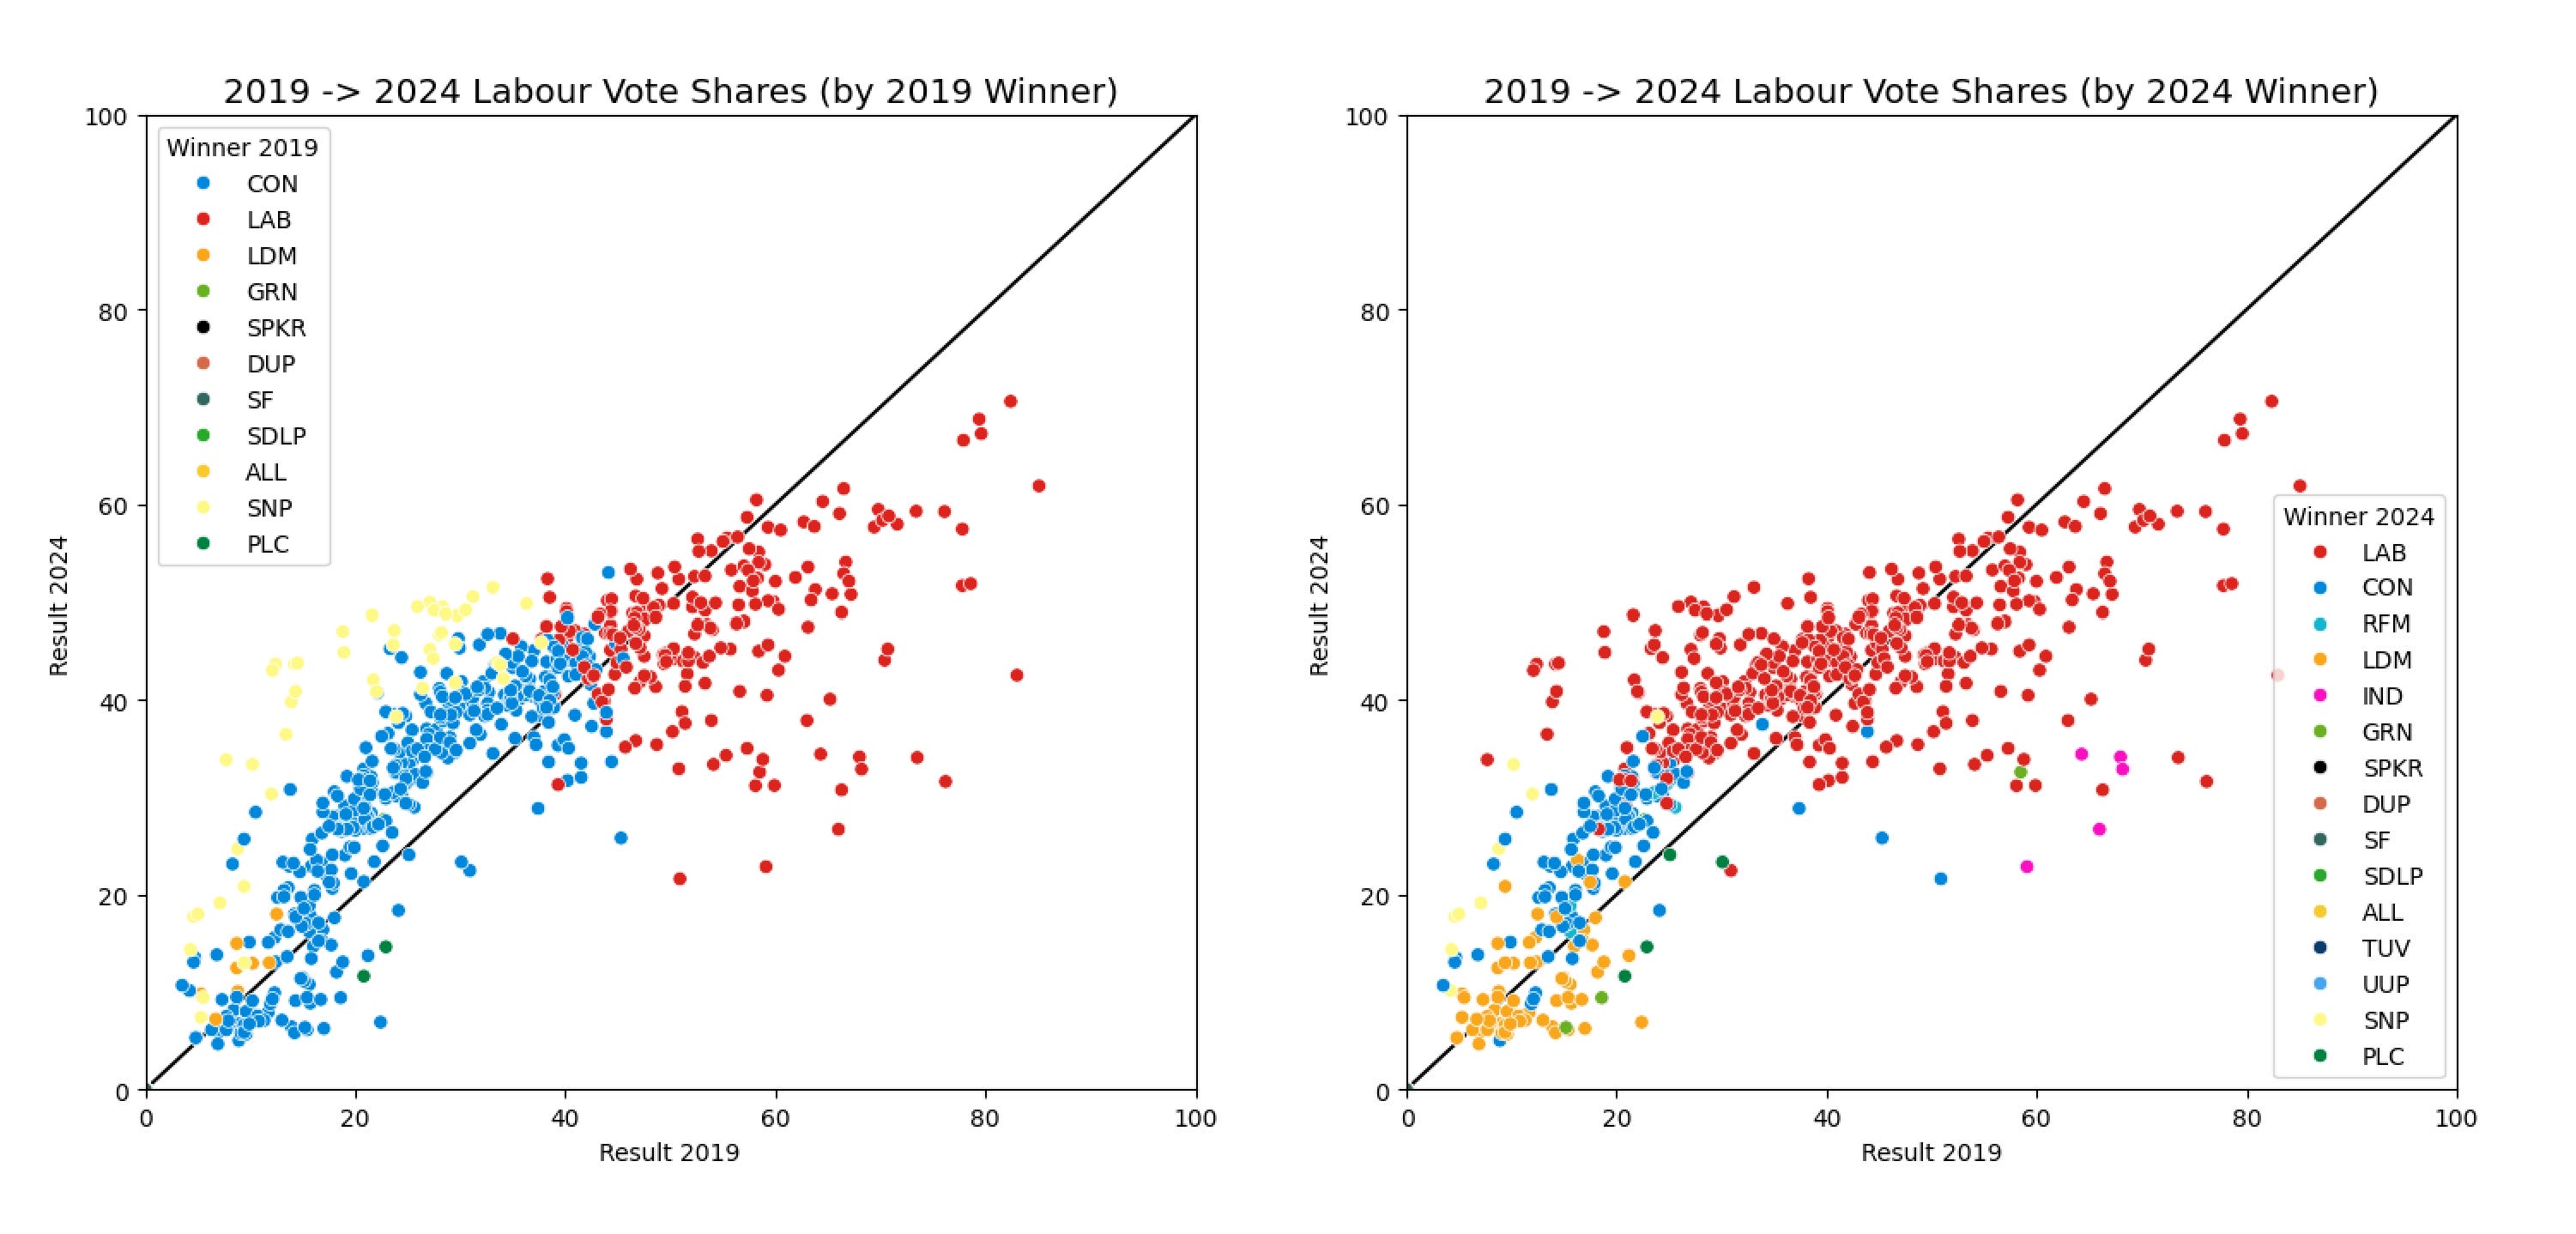
For me, this is a graph that tells a thousand stories7. Here are four:
Labour’s biggest ‘relative swing’ comes in Scotland, all but wiping out the SNP—the nationalist party’s various woes will have greatly contributed here.
Labour either holds steady or loses votes in the seats where they had fewest votes in 2019. These seats almost all fell to the Liberal Democrats (or went Green)—the power of tactical voting!
Seats where Labour came second last time typically see big, positive swings in their favour—yes, Reform UK certainly helped the Tories on their way, but Labour’s reach into the centre ground also proved decisive.
Labour goes backwards in the majority of the constituencies it already held (at the margins, losing a handful to independent or Green candidates).
In short, Labour gained votes (sometimes huge numbers of votes) everywhere it needed them—and lost them everywhere it did not. This (along with Reform splitting the right-wing vote) explains the apparent paradox of a lacklustre vote share delivering a supermajority.
At this point I really must pause to acknowledge the fact that it would be impossible to do analysis of this kind without the huge amount of work that goes into open data and open source software. Particular shouts-out to ElectionMapsUK (who crowdsourced a massive results spreadsheet), the folks behind poli-sci-kit (which made that graphic of parliamentary seats very easy to build), and countless Wikipedia editors who make it very easy to track and aggregate polling results.
In case it needs clarification: this is how I feel about the quality of my predictions, not (necessarily?) how I feel about the actual outcomes!
That’s the vote share in Great Britain. If you include Northern Ireland it’s 33.7%, but most pollsters predict for Britain rather than the United Kingdom … so 34.7% is what we should compare to their predictions. In the case of those that do poll the entire country, I’ve adjusted their figures for the purposes of comparison.
And while I appreciate that most people care more about whether it affected the result, pollsters should care about being four percentage points out just as much whether it materially affected the headline prediction or not.
There’s some additional spread in these distributions, reflecting the fact that opinion polls each have natural uncertainty of ±2 percentage points.
Some pollsters were much further off; People Polling had the Conservatives on 16% and Reform on 20% (this wasn’t an outlier poll for them, either). That’s not late swing—that’s just a poor prediction.
650, at a minimum.